> ## Documentation Index
> Fetch the complete documentation index at: https://julius.ai/docs/llms.txt
> Use this file to discover all available pages before exploring further.

# Getting Started

> Welcome to Julius! In this quickstart guide, we'll walk you through how to upload data, start a conversation, select a data source, analyze and visualize your data, and how to export your results!

<div style={{ display: "flex", justifyContent: "center" }}>
  <iframe width="560" height="315" src="https://www.youtube.com/embed/ir8qShUBCco?si=t734DR3X96UXAJH1" title="YouTube video player" frameborder="0" allow="accelerometer; autoplay; clipboard-write; encrypted-media; gyroscope; picture-in-picture; web-share" referrerpolicy="strict-origin-when-cross-origin" allowfullscreen />
</div>

<Steps>
  <Step title="Upload your data" icon="upload">
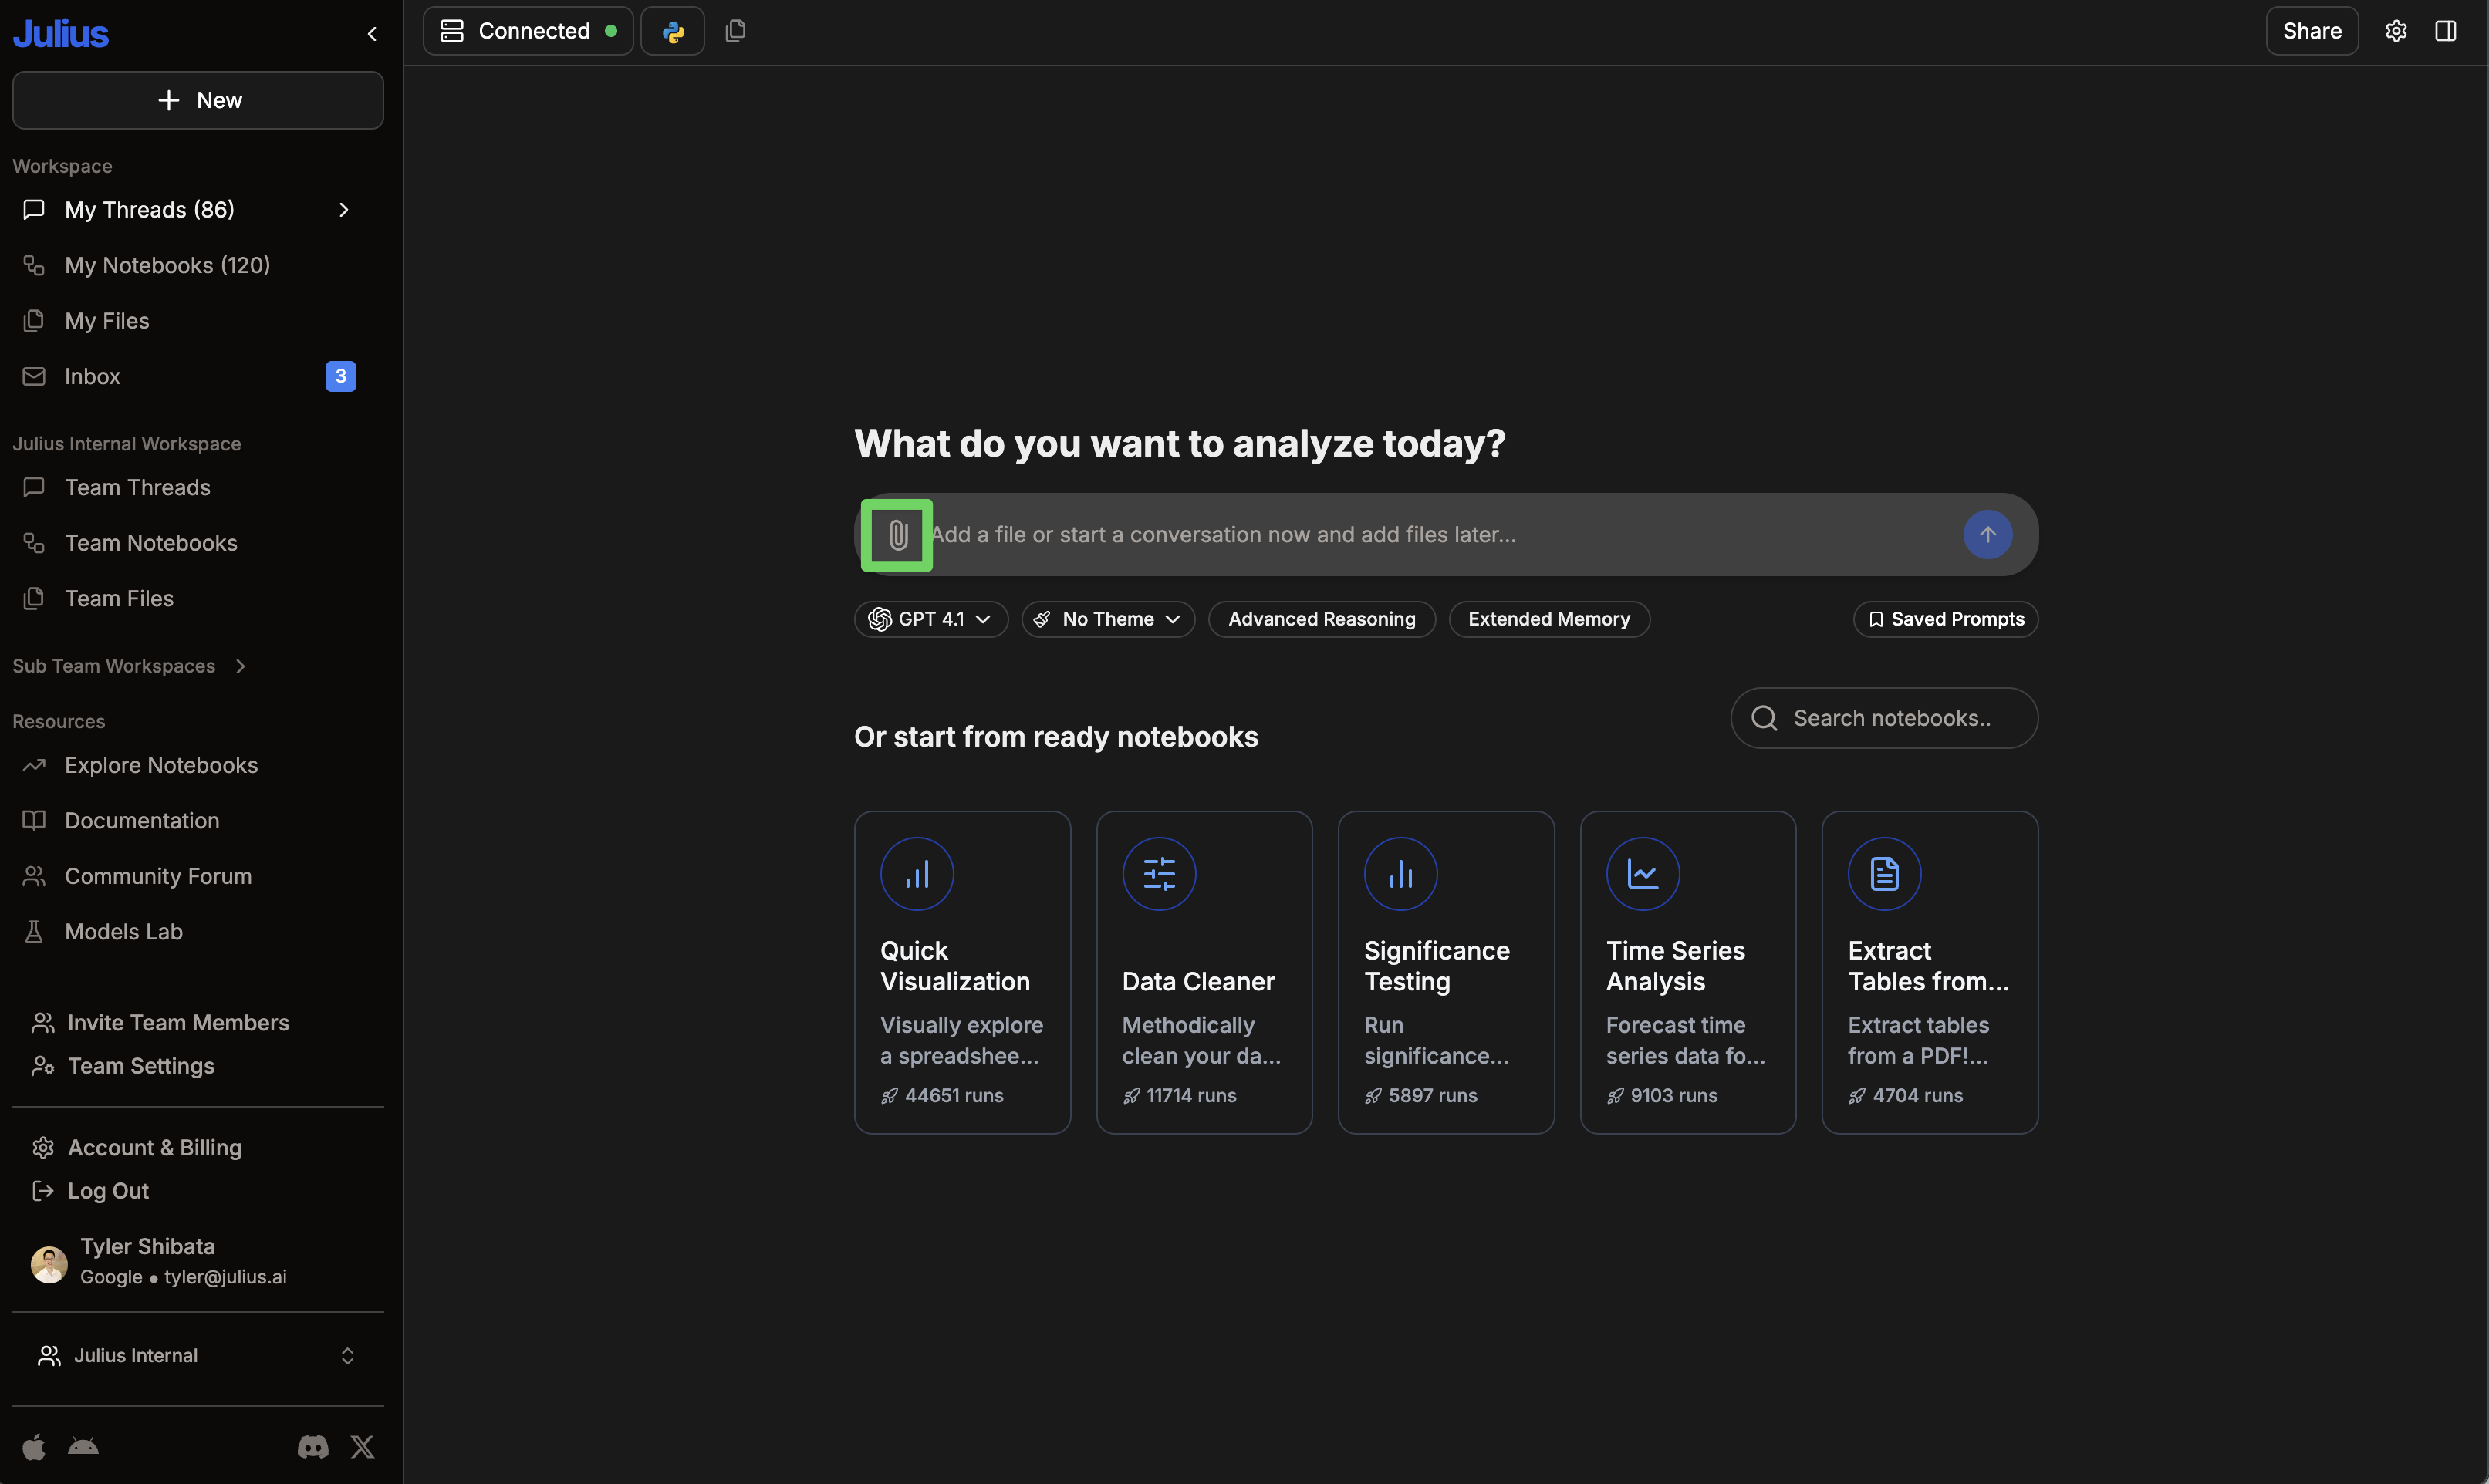
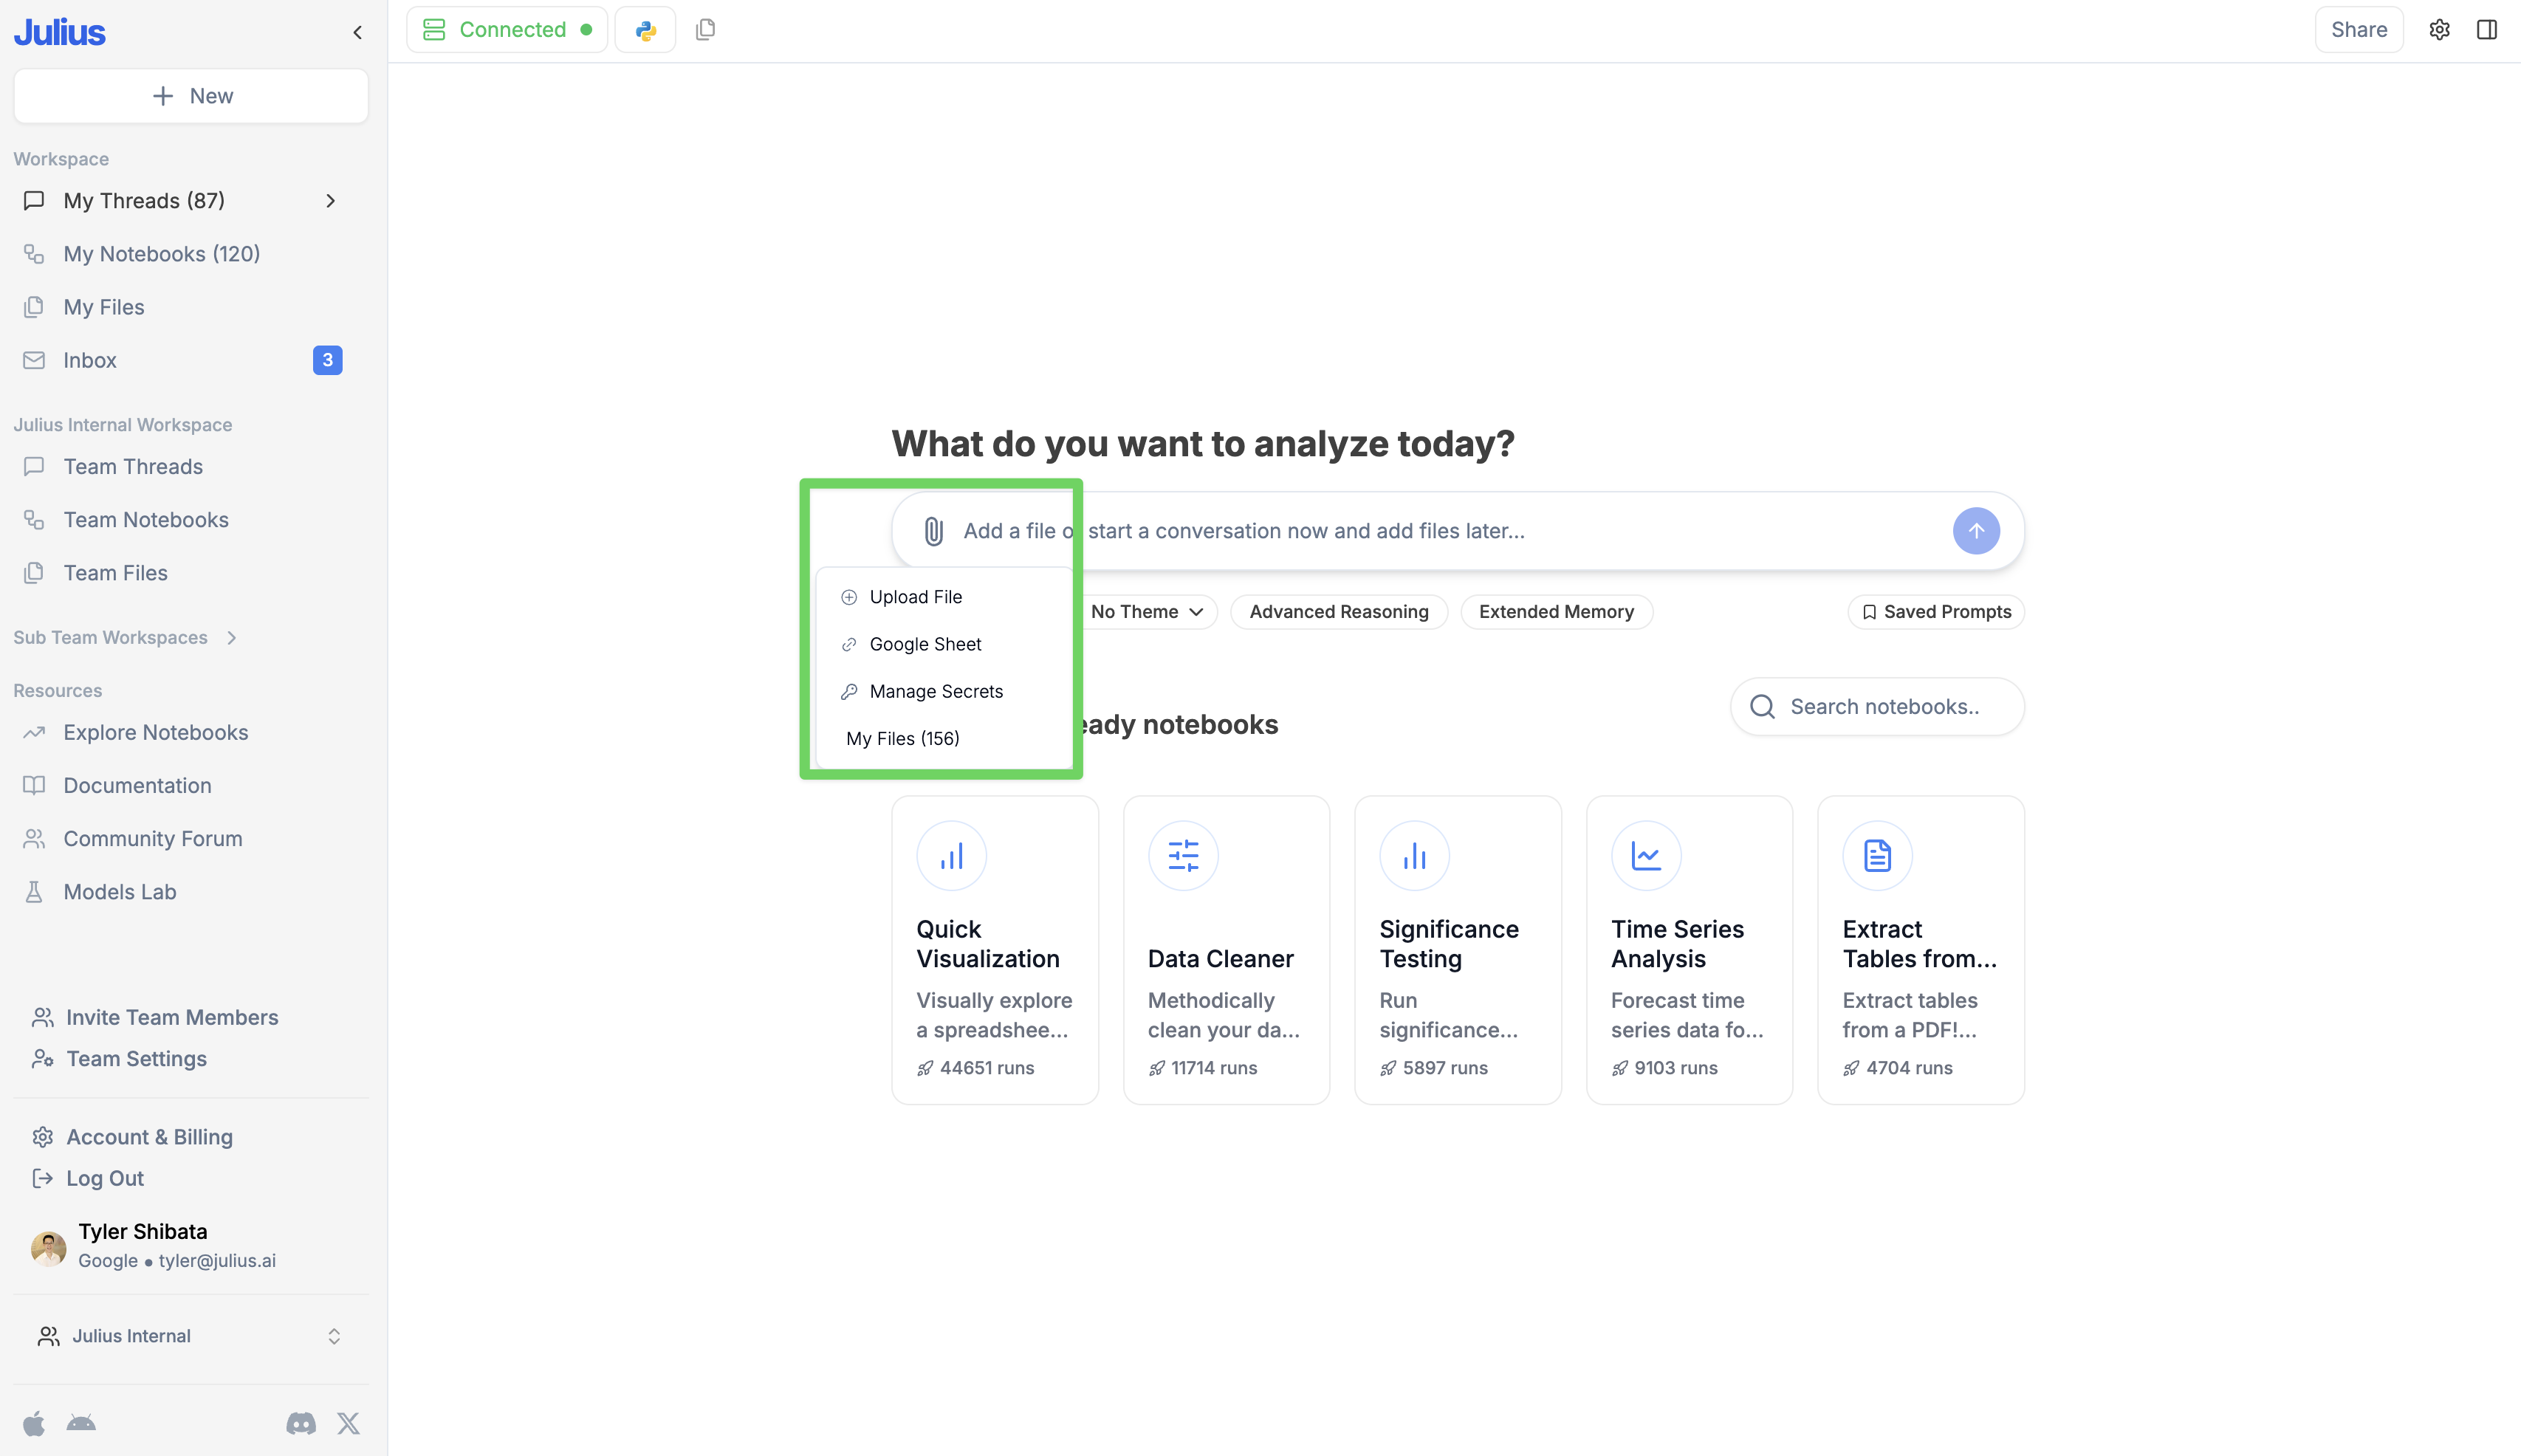
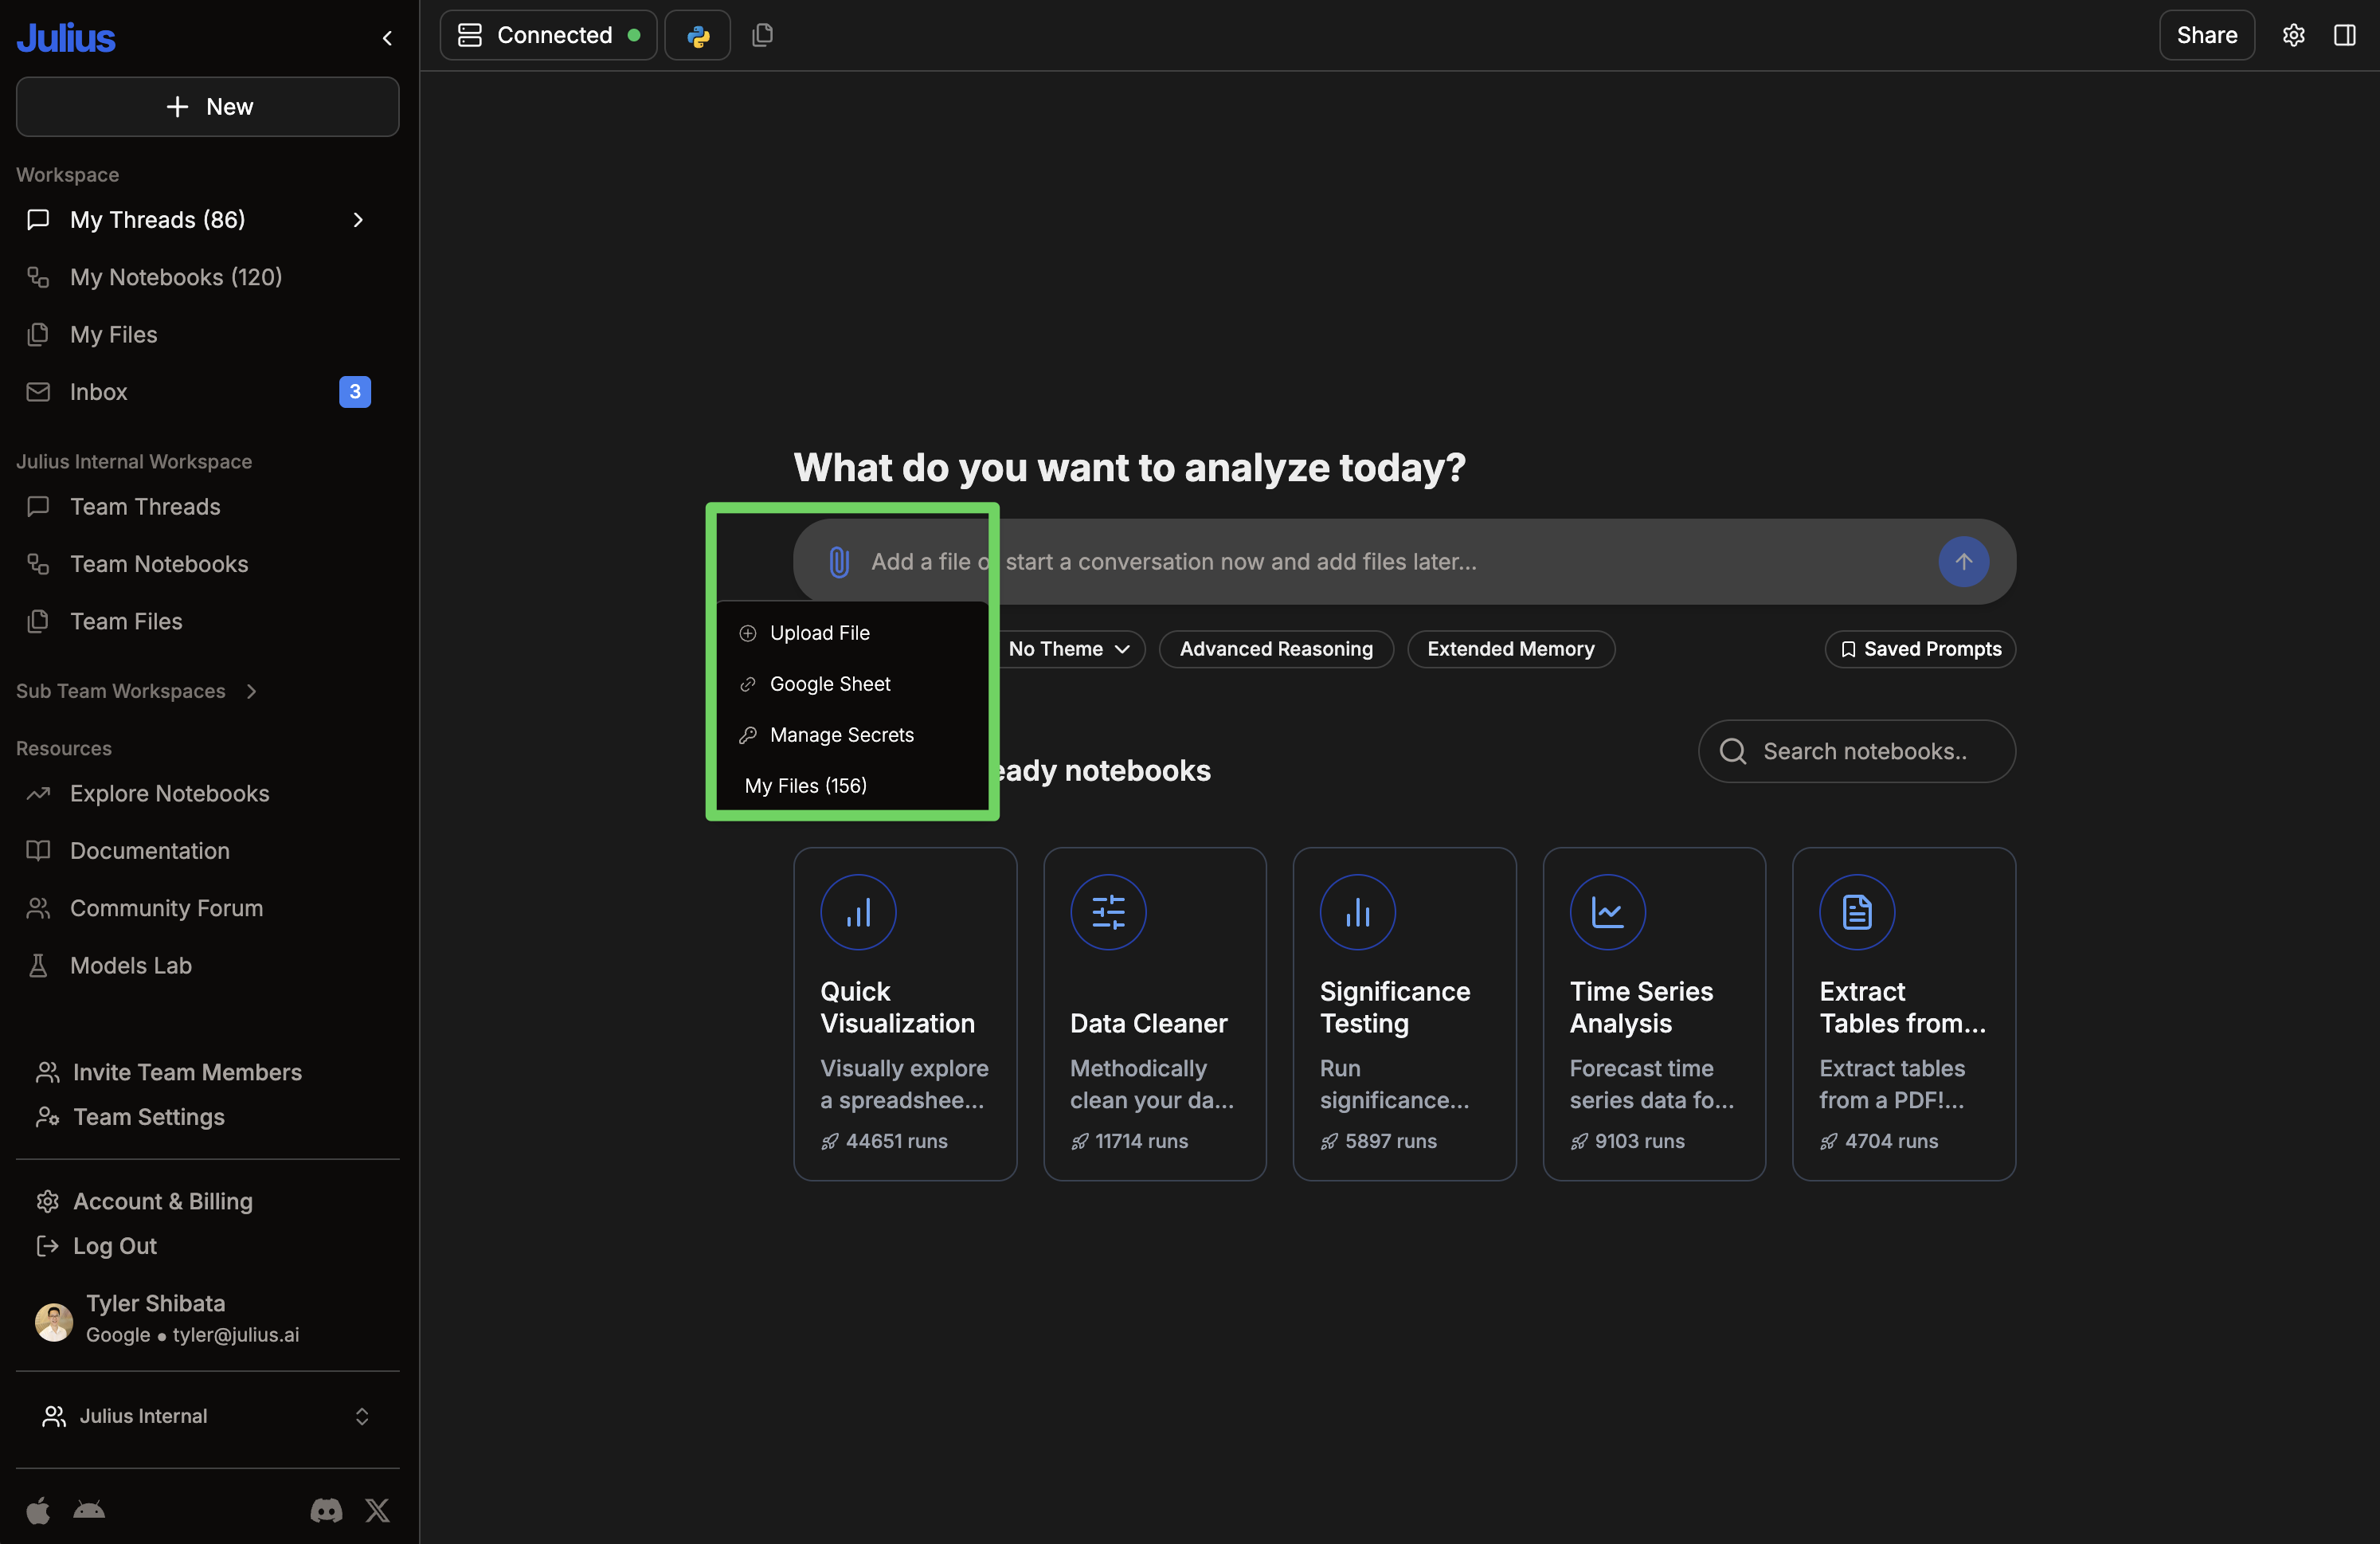
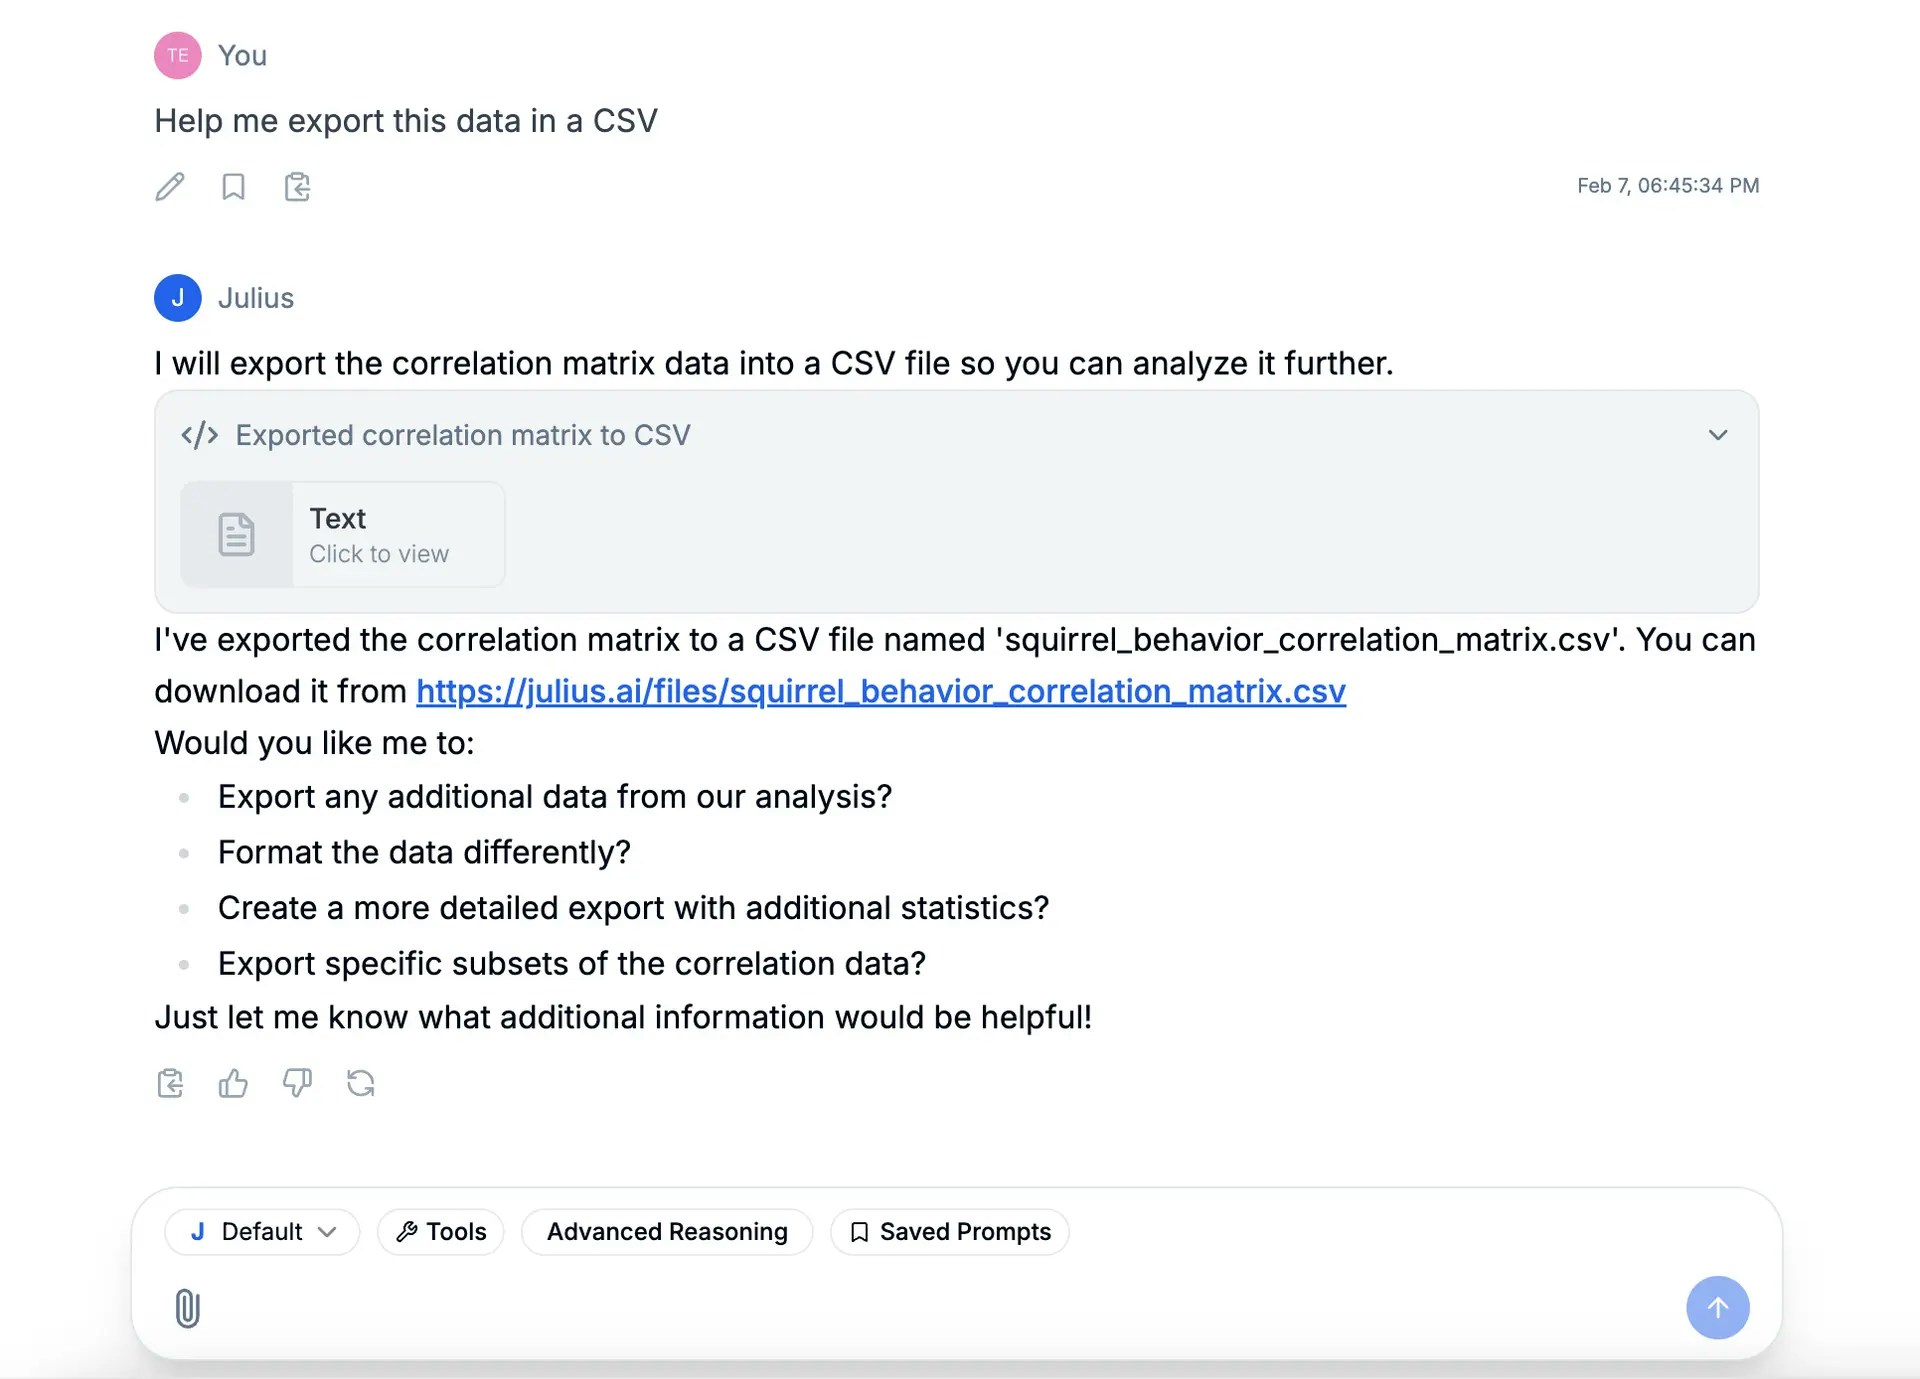
    Click the 📎 icon or drag a file into the conversation window. Julius supports CSVs, Excel, JSON, PDFs, images, and more. See [Files](/get-started/files) for the full list.

    <div align="center">
      <img className="block max-w-[90%] h-auto dark:hidden" src="https://mintcdn.com/julius-d061c216/1sdX0_SBCoFyQQNg/images/get-started/upload-file1-light.png?fit=max&auto=format&n=1sdX0_SBCoFyQQNg&q=85&s=ef72dadd58e31ba42ba43b1ac781ceb5" width="3422" height="1980" data-path="images/get-started/upload-file1-light.png" />

      <img className="hidden max-w-[90%] h-auto dark:block" src="https://mintcdn.com/julius-d061c216/1sdX0_SBCoFyQQNg/images/get-started/upload-file1-dark.png?fit=max&auto=format&n=1sdX0_SBCoFyQQNg&q=85&s=611dde0b1a9f703cf54b887f3b6a2d81" width="3226" height="1924" data-path="images/get-started/upload-file1-dark.png" />
    </div>

    <div align="center">
      <img className="block max-w-[90%] h-auto dark:hidden" src="https://mintcdn.com/julius-d061c216/1sdX0_SBCoFyQQNg/images/get-started/upload-file2-light.png?fit=max&auto=format&n=1sdX0_SBCoFyQQNg&q=85&s=782740220c6b06dfa618bcc6ab71054c" width="3414" height="1972" data-path="images/get-started/upload-file2-light.png" />

      <img className="hidden max-w-[90%] h-auto dark:block" src="https://mintcdn.com/julius-d061c216/1sdX0_SBCoFyQQNg/images/get-started/upload-file2-dark.png?fit=max&auto=format&n=1sdX0_SBCoFyQQNg&q=85&s=0d16049a923086be7db2e07abe7ce104" width="2988" height="1938" data-path="images/get-started/upload-file2-dark.png" />
    </div>

    <Tip>
      You can also connect databases and warehouses directly. See [Data Connectors](/data-connectors/overview).
    </Tip>
  </Step>

  <Step title="Ask questions about your data" icon="screwdriver-wrench">
    Once your data is loaded, just ask Julius what you want to know in plain language.

    > Show me the average sales by product category

    > Sort the data by customer age

    <video src="https://r2.julius.ai/transform-data-light.mp4" autoPlay muted loop playsInline className="block dark:hidden w-full rounded-lg" />

    <video src="https://r2.julius.ai/transform-data-dark.mp4" autoPlay muted loop playsInline className="hidden dark:block w-full rounded-lg" />
  </Step>

  <Step title="Create visualizations" icon="chart-column">
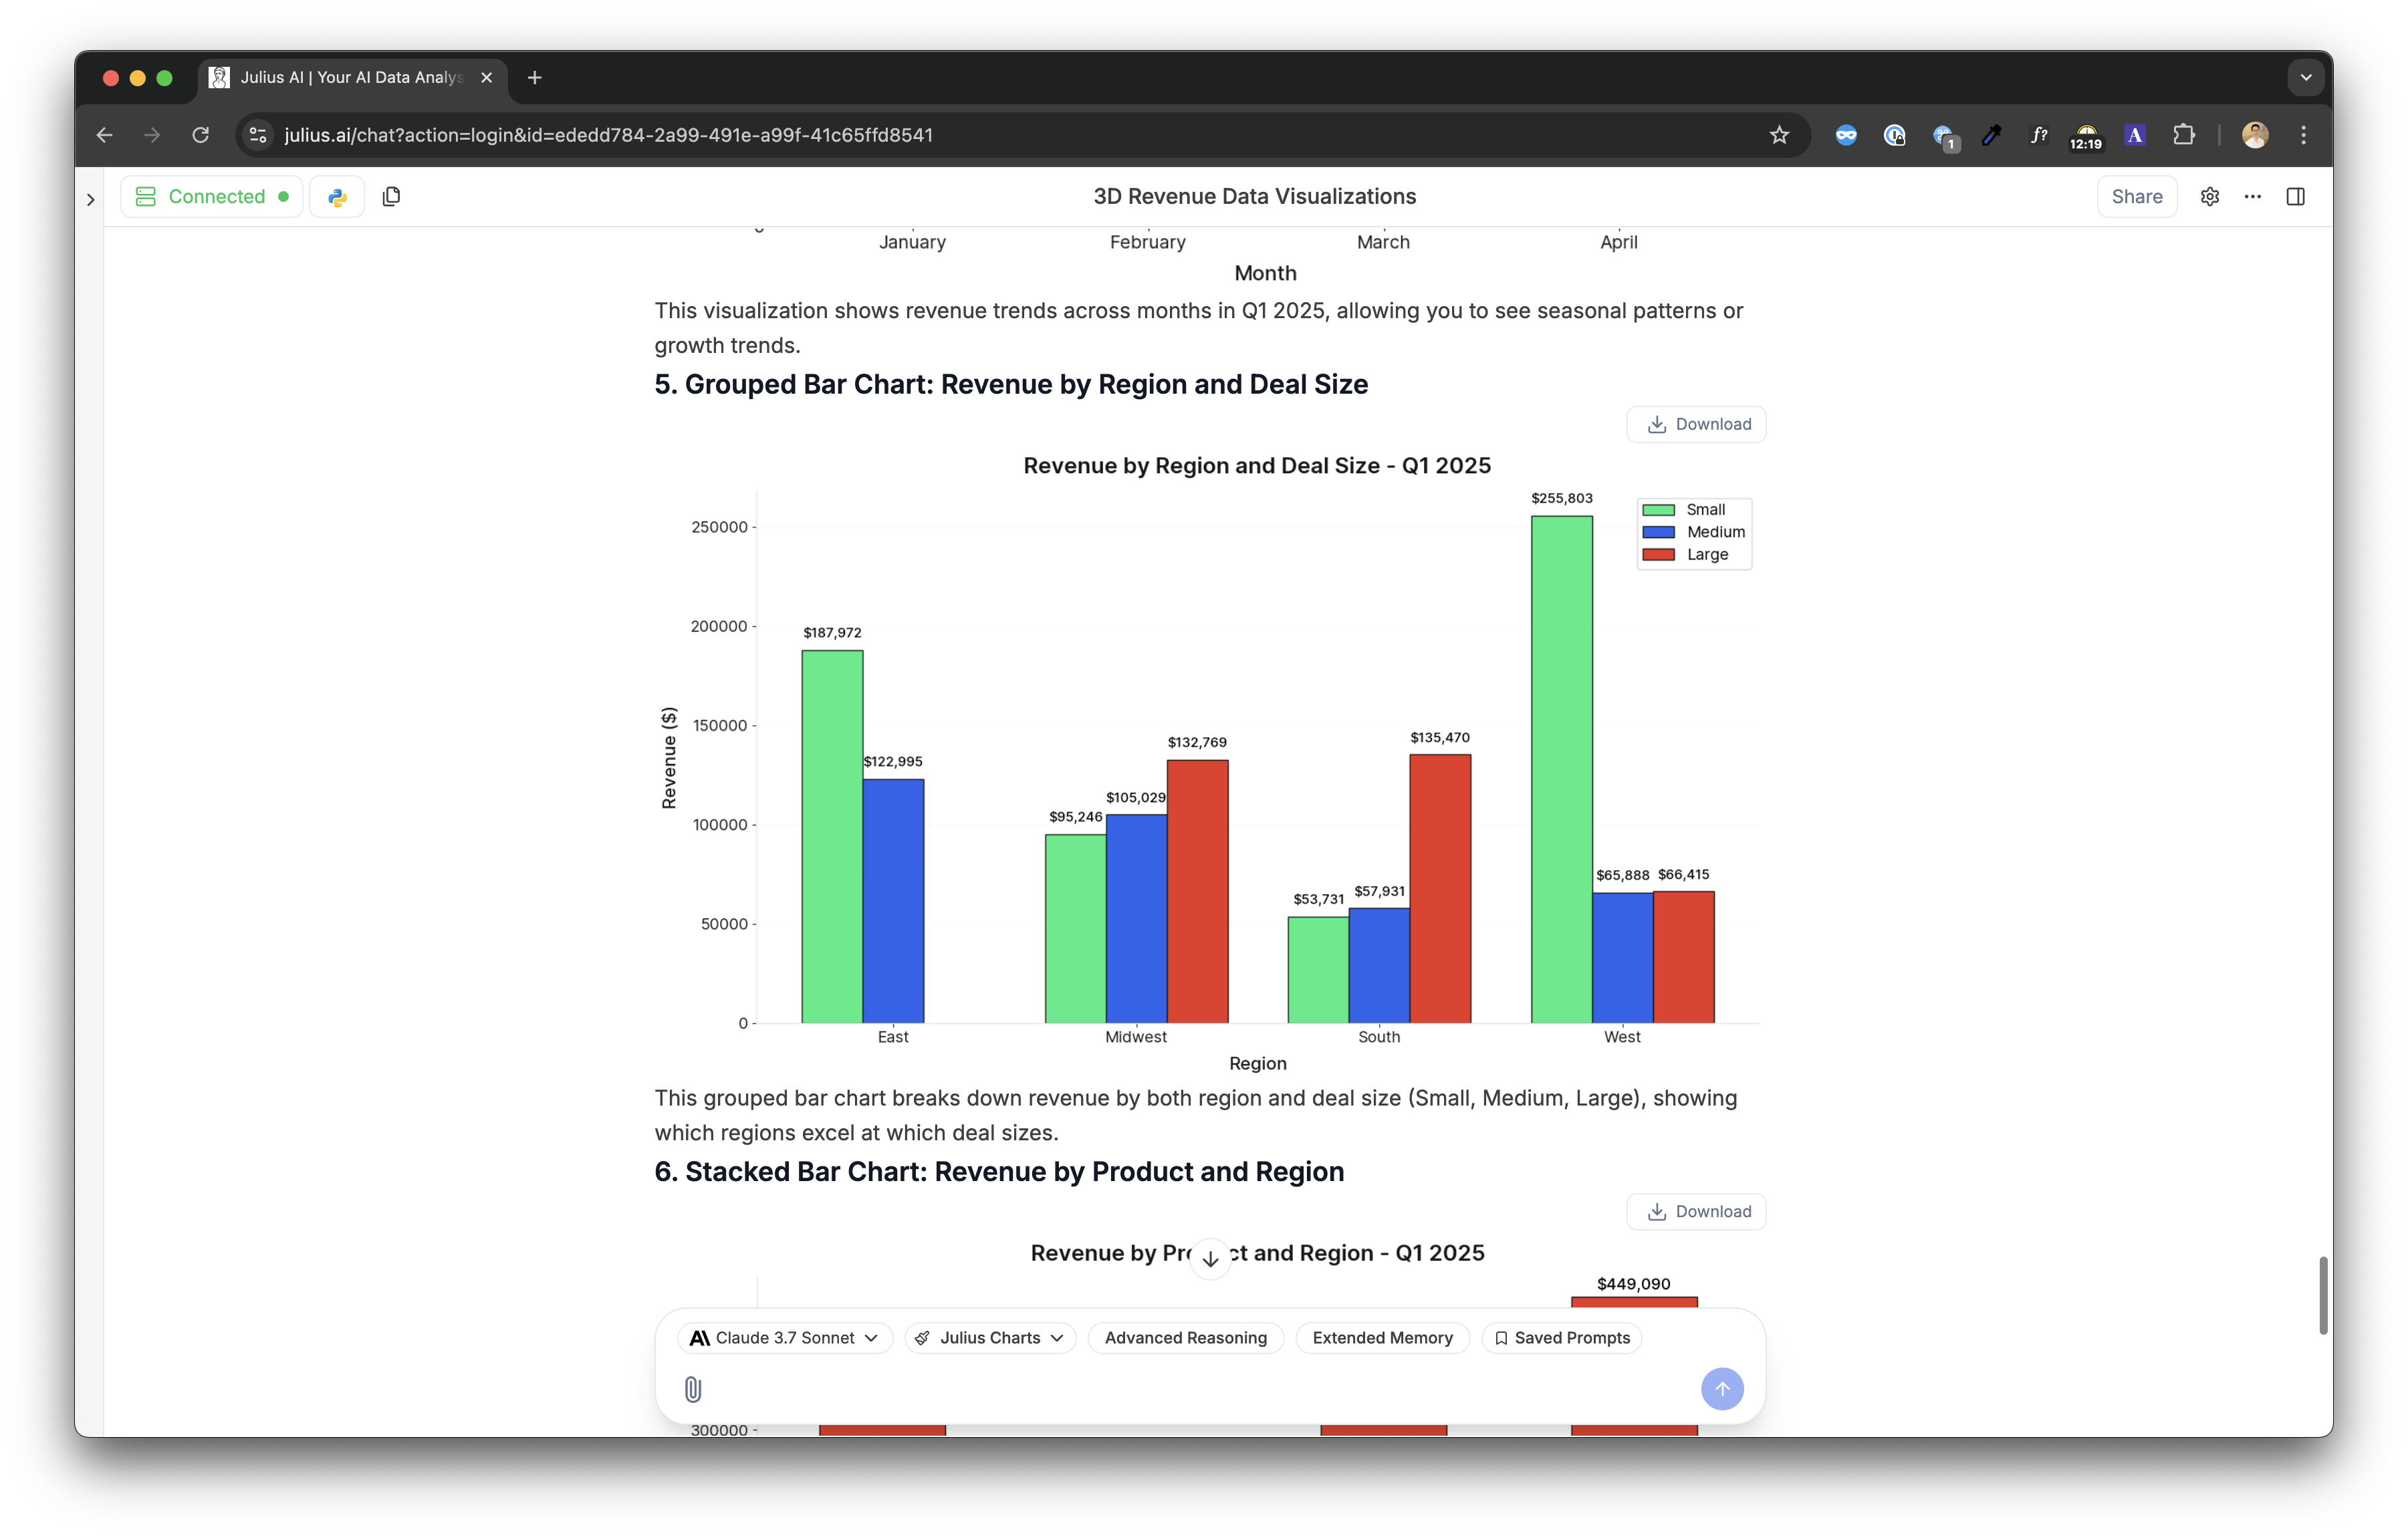
    Ask Julius to visualize your data. Just describe what you want to see.

    <Tabs>
      <Tab title="Bar plots">
        Compare quantities across categories.

        > Show me a bar plot of sales by product category
      </Tab>

      <Tab title="Line plots">
        Show trends over time.

        > Show me a line plot of sales over time
      </Tab>

      <Tab title="Scatter plots">
        Show the relationship between two variables.

        > Show me a scatter plot of age versus income
      </Tab>

      <Tab title="Histograms">
        Show the distribution of a variable.

        > Show me a histogram of customer ages
      </Tab>

      <Tab title="Pie charts">
        Show the proportion of categories.

        > Show me a pie chart of sales by region
      </Tab>
    </Tabs>

    <img src="https://mintcdn.com/julius-d061c216/FYM8NUtCrVJzhSKO/images/get-started/quickstart/get-started-visualization-example.png?fit=max&auto=format&n=FYM8NUtCrVJzhSKO&q=85&s=a6ee9b598064da950b8a3eb6f28d628a" alt="Example visualization generated in Julius" width="3602" height="2298" data-path="images/get-started/quickstart/get-started-visualization-example.png" />

    Right-click any visualization to copy or save it. For more on what's possible, see [Data Visualizations](/get-started/data-visualizations).
  </Step>

  <Step title="Export and share" icon="share-nodes" iconType="regular">
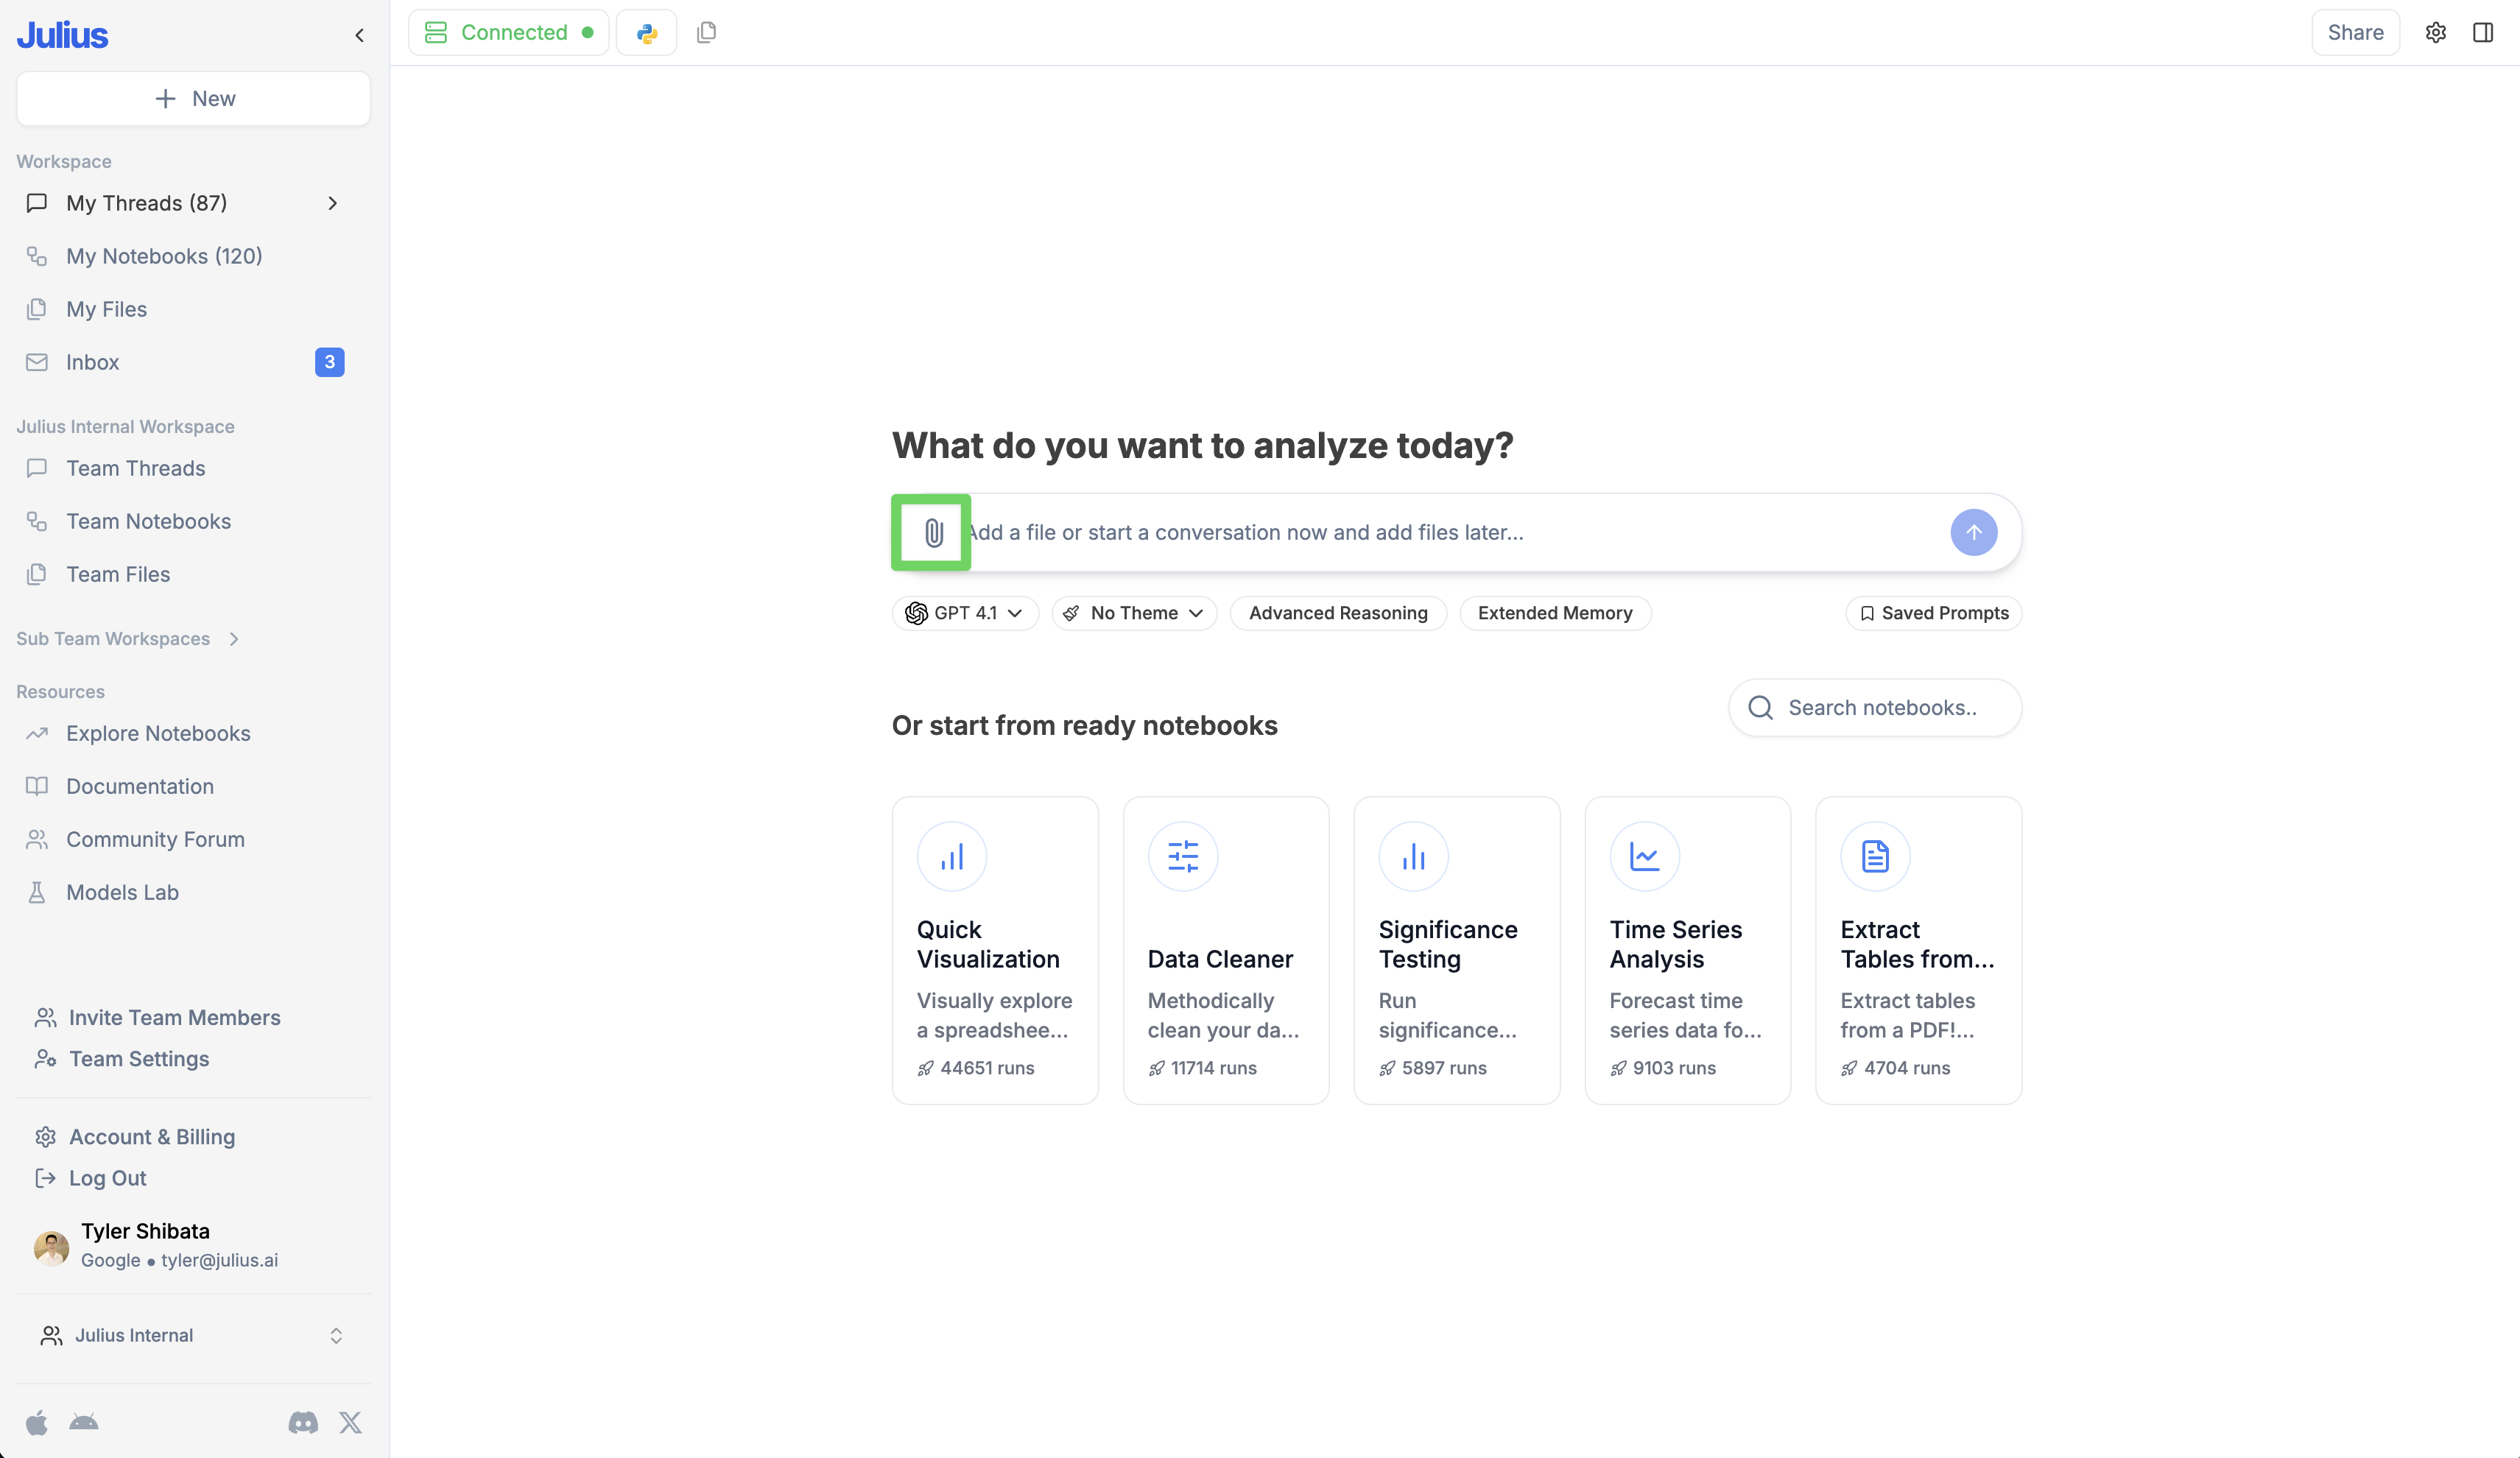
    * **Export data:** Ask Julius to export your results as CSV or Excel. A download link will appear in the chat.
    * **Save visualizations:** Right-click any chart to copy or download it.
          <img src="https://mintcdn.com/julius-d061c216/1sdX0_SBCoFyQQNg/images/get-started/exporting-data.webp?fit=max&auto=format&n=1sdX0_SBCoFyQQNg&q=85&s=98640bfd67a009c559a5bc9d148e18d0" alt="" width="1920" height="1379" data-path="images/get-started/exporting-data.webp" />
  </Step>
</Steps>